paged.slide reads PowerPoint .pptxdecks onto the engine and writes them back. The import, the Slides and Notes panels and the first part of PowerPoint export are built and tested. The editor loads the plugin only on a development branch, until the package is published; the slideshow and presenter view are not built. Everything below is measured on the plugin’s own fixtures and real decks — none of it is something you can open on this site today.
paged.slide — coming, not yet in the editor
PowerPoint, typeset
PowerPoint decks on the engine: every preset shape, every built-in table style, charts and SmartArt, laid out within a point of PowerPoint.
187
74
1 pt
0.88–0.995
Status — coming
Built and measured; not in the editor yet
Geometry — every preset, within a point
All 187 preset shapes, measured against PowerPoint
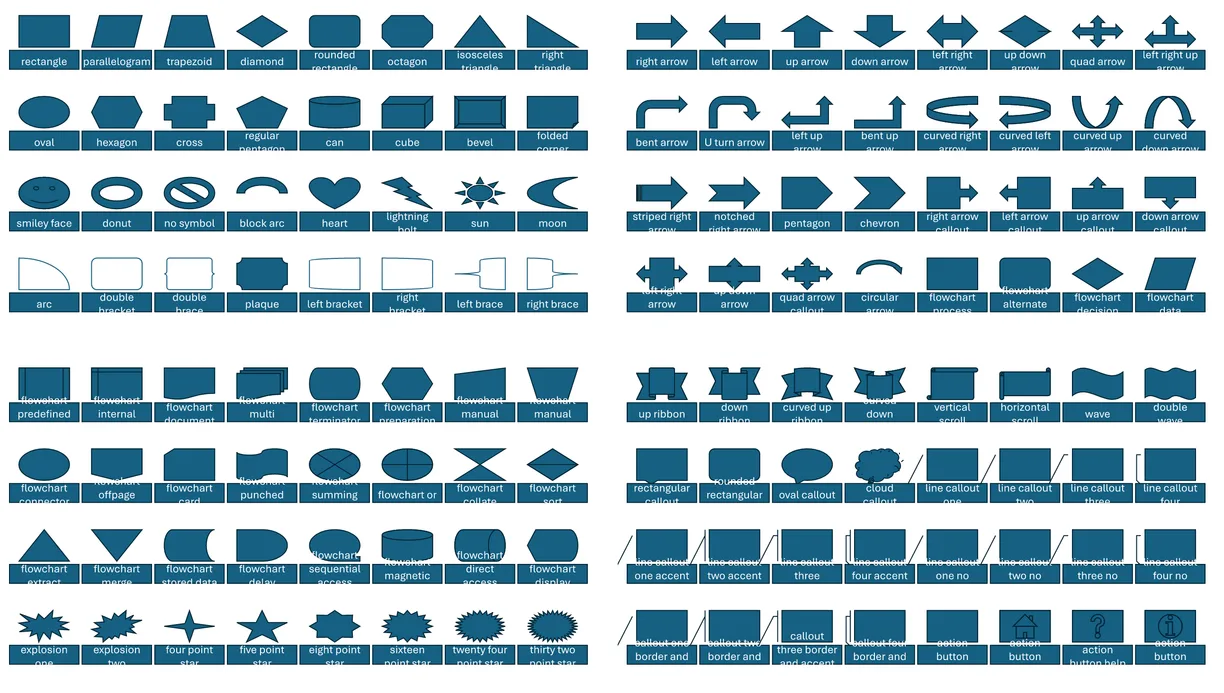
Every one of the 187 ECMA-376 preset shapes, and custom geometry, becomes a Bézier outline. Scripts drive PowerPoint to report each shape’s geometry, and the import is compared with it: 412 shapes in the fixtures and 1,504 in real decks land within 1 pt.
First baselines and line pitch agree within the PDF’s 0.96 pt quantum plus 1% of the size, across five fonts, three sizes and four spacings.
Structure — tables, charts and SmartArt as native items
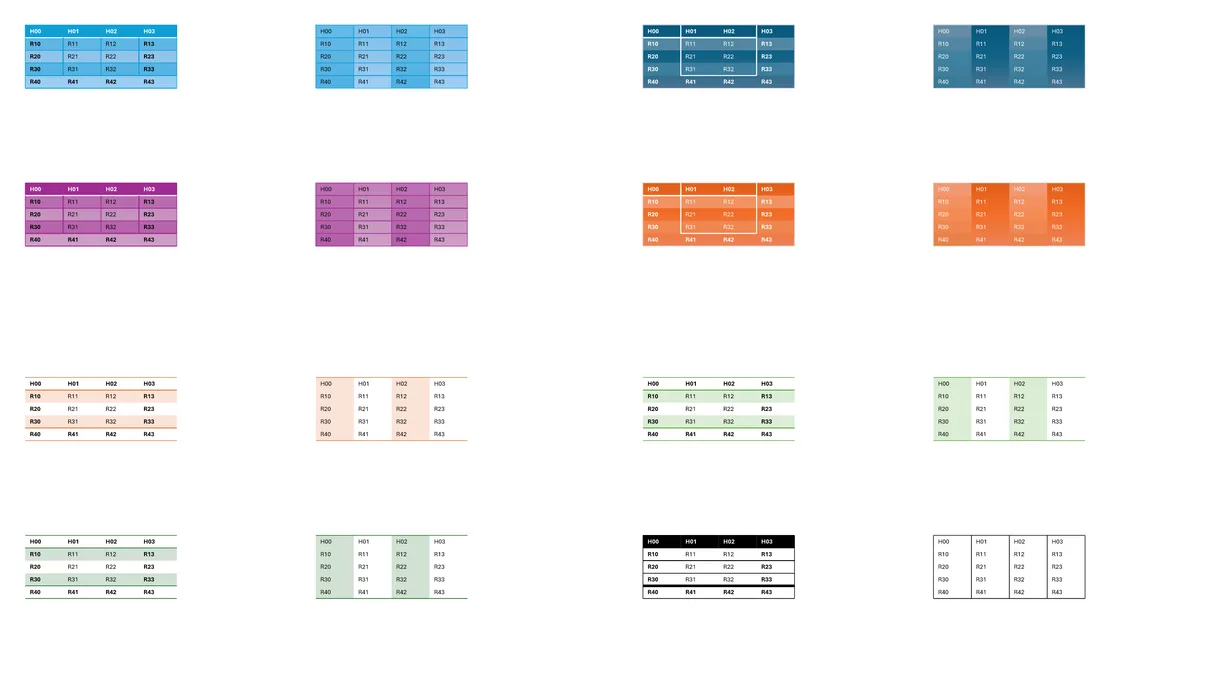
Every built-in table style, cell by cell
- Table styles
- All 74 built-in styles and a deck's own, resolved in PowerPoint's layer order: every fill within 4 RGB units across 150 tables, weights, text colours and borders exact.
- Charts
- Bars, lines, areas, pies and doughnuts, with Excel's automatic scale, drawn as groups of native shapes — 44 bars within 3 pt of PowerPoint.
- SmartArt
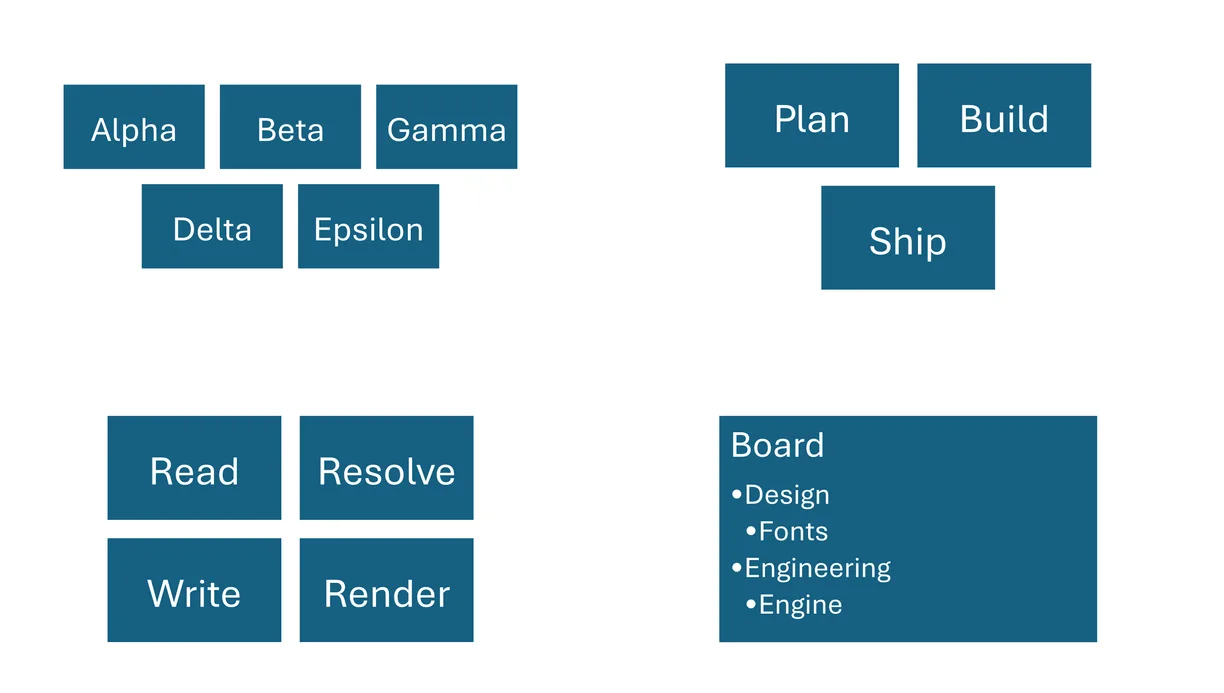
- Each diagram's drawing becomes native shapes: every block within 1 pt, text colours exact.
Fidelity — seven real decks against PowerPoint’s PDF
Slide by slide, scored
PowerPoint is the oracle. Seven real decks are converted, rendered with the fonts PowerPoint drew them with, and compared with PowerPoint’s own PDF slide by slide. Medians run from 0.882 to 0.995.
Where a deck falls short, the cause is mostly fonts: a plugin cannot register a face with the editor yet, and one deck’s title face is missing on the oracle machine too.
| Deck | Slides | Median | Worst |
|---|---|---|---|
| animation pitch deck | 20 | 0.941 | 0.908 |
| black-pink business proposal | 20 | 0.917 | 0.878 |
| creative agency profile | 20 | 0.939 | 0.900 |
| green minimalist proposal | 20 | 0.882 | 0.818 |
| orange creative pitch deck | 20 | 0.942 | 0.898 |
| white company profile | 20 | 0.910 | 0.826 |
| white-lime education | 4 | 0.995 | 0.995 |
Export — the first part
An untouched deck goes back byte for byte
Export as PowerPoint writes the deck from the original the importer kept. An unedited deck comes back byte-identical. Reordered, duplicated, deleted and hidden slides and edited speaker notes are written back, and PowerPoint opens the result without a repair prompt, every page pixel-identical to the expected slide. Regenerating the content of an edited slide is the next part.